
Basics
What is market breadth?
Market breadth shows what percentage of stocks inside an index are trading above their moving averages, such as the 20-, 50-, 100-, or 200-day average.
This helps you understand not only the direction of the index itself, but also the market's internal condition. If most stocks are above their averages, the advance has broad support and the market looks stronger. If the index rises while only a small share of stocks remain above their averages, the move may be weaker and narrower, driven mostly by a few large companies.
Composite view of S&P500 breadth
Five breadth indicators, five market horizons
Explore each time horizon in detail, from short-term momentum to broad macro cycles. Choose a category to see how it affects market mechanics.
The fastest breadth indicator in our toolkit. It answers a simple question: how broadly is the market moving up or down right now in the short term? Think of it as the temperature gauge for the current week.
When 5-day breadth reaches extreme values above 90% or below 10%, it can signal local overheating or panic. It is a useful tool for traders looking for intraweek reversal points or momentum confirmation for trend entries.
Use 5D to identify buying or selling climaxes during short-term pullbacks.
20-day breadth is a foundation for swing trading. It covers roughly a trading month and shows whether the current index move is truly broad-based.
Unlike 5D, this metric is more resistant to noise. If the index rises while 20D breadth stalls or declines, it creates a classic divergence: a sign that the rally is losing steam and depends on a narrow group of leaders.
A move above 50% confirms bullish momentum.
Holding above 70% marks a period of strong trend acceleration.
A drop below 20% marks an area to look for a medium-term rebound low.
The gold standard for analyzing market health. The 50-day moving average is a key reference for institutional investors. The percentage of stocks above this level shows how many companies are in an active growth phase.
When this value sits in the 40-60% range, the market often looks balanced. A breakout above 80% often comes before a euphoric phase, while a drop below 15% has historically correlated with major market lows.
BreadthView lets you track this metric in real time, giving you an advantage over analytical reports that usually arrive with a delay.
An intermediate layer between medium-term and long-term trends. 100-day breadth acts as a bridge of strength and filters out even deeper corrections that have not yet broken the market's core structure.
This horizon is especially important when analyzing the Nasdaq100, where volatility is higher. If 100D breadth remains stable around 60%+ during market turbulence, it often suggests that large positions are not being sold and the correction remains a technical reset.
The global barometer. 200-day breadth defines the market's long-term structure for months and years ahead. It is the fundamental boundary between a bull market and a bear market.
When more than 70% of S&P 500 stocks are above their 200-day average, the market is considered structurally healthy and pullbacks are more often viewed as opportunities to build positions. When the value falls below 30%, the risk of structural deterioration rises.
Investors should monitor this metric to manage overall portfolio risk and decide how much cash to hold in their strategy.
Methodology
How to use BreadthView in real work
Finding reversals
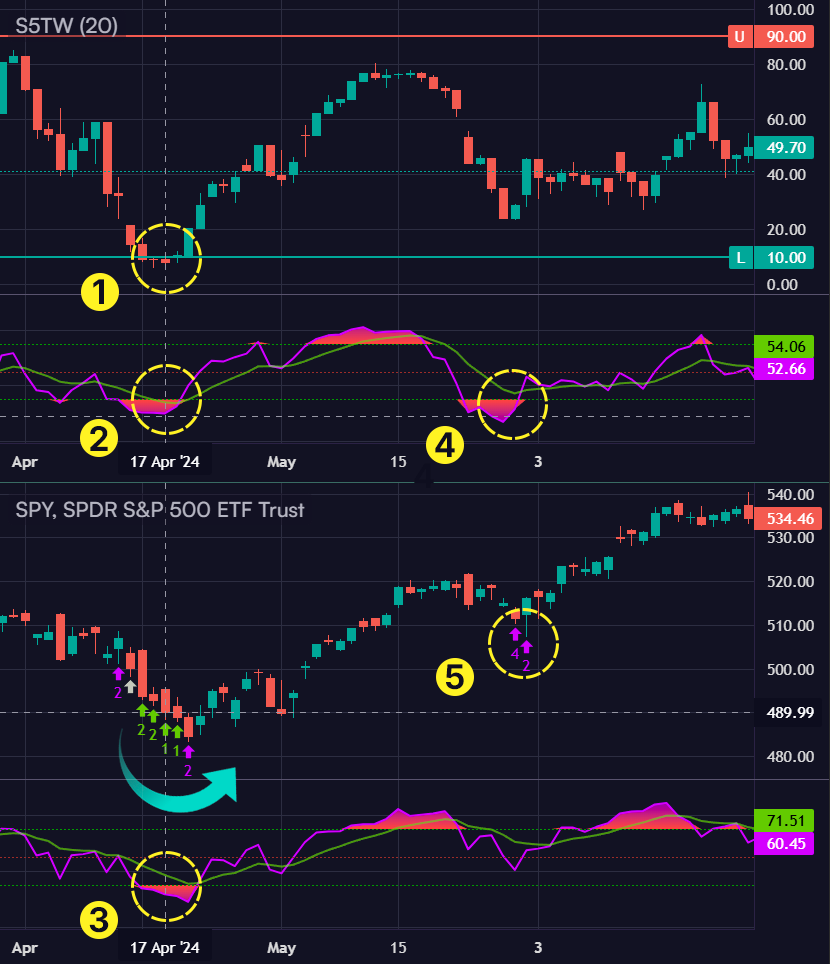
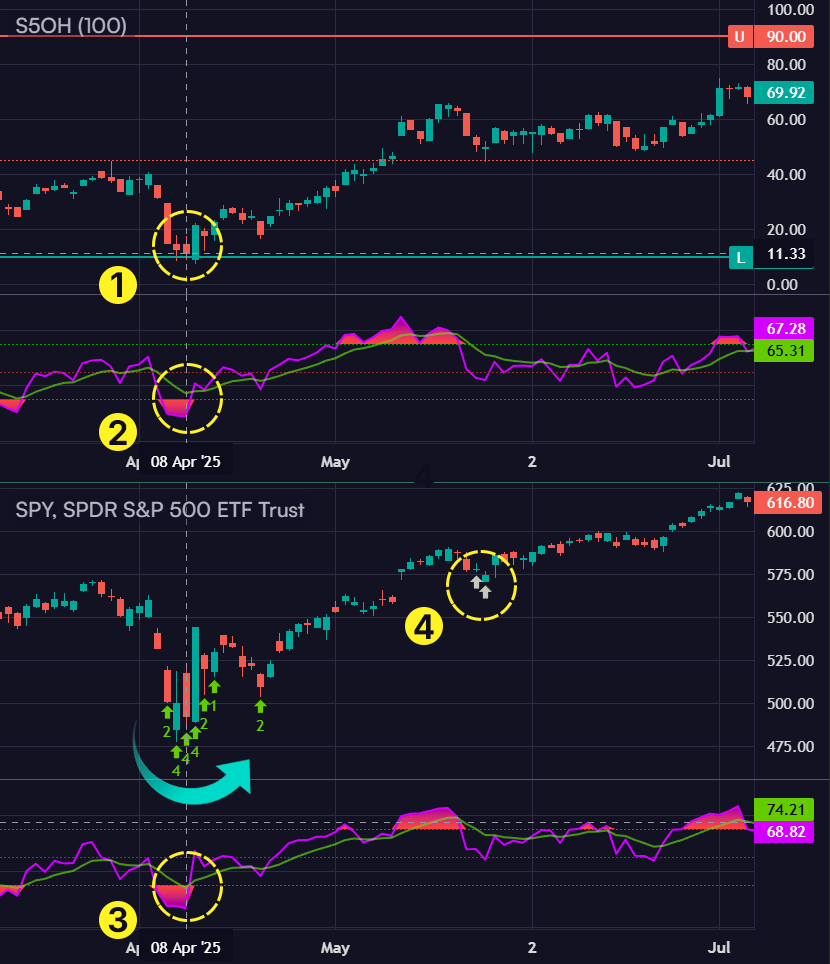
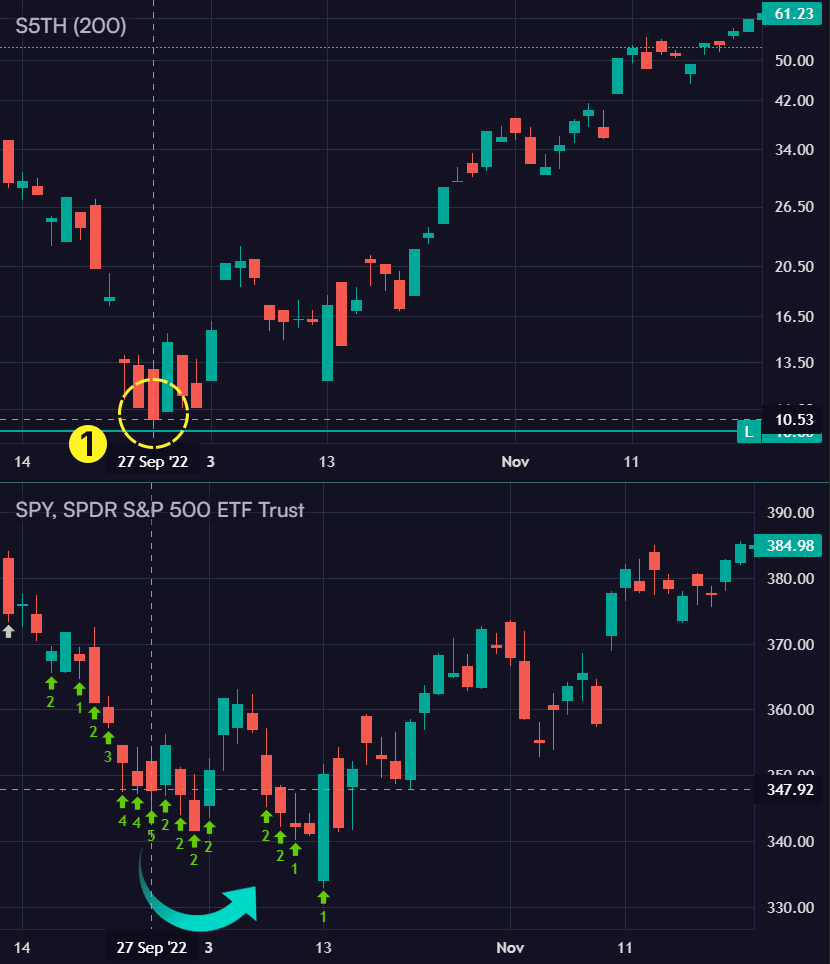
Watch how the index price reacted historically when breadth reached its lows near the 10% zone. In a bull market, these are often rare entry opportunities, and vice versa.
Confirming strength
If the index is rising and breadth indicators are rising too, the move has healthier and broader market participation.
Finding rebounds
In a strong bull market, breadth indicators may not reach their minimum zones. In that case, RSI helps identify potential rebound points.
Detecting weakness
If SPY or QQQ remain firm while breadth starts to decline, it can be an early warning of a possible market pullback.
Understanding the phase
Breadth indicators make it easier to see transitions between weakness, recovery, a sustained trend, and potential overheating.
Finding divergences
A divergence between the RSI chart and the breadth chart can hint at a possible trend change.
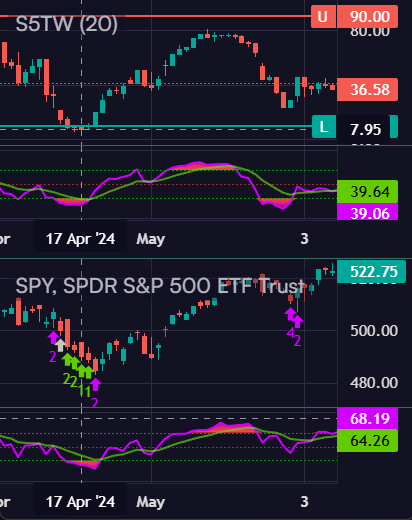
Who BreadthView is for
BreadthView use cases
Choose your main trading goal to see a practical platform use case.
ETF investor
Macro Strategic Investor
"Instead of sitting through drawdowns, I wait for moments of historical panic to enter."
Practical strategy:
For a long-term investor, avoiding entries at euphoric peaks is critical. BreadthView makes it easy to see the market's real condition through long breadth horizons, from 50D to 200D.
When 50D or 200D breadth reaches 10%, fear is usually extreme. Historically, these have been some of the best long-entry moments for months and years ahead.
When breadth rises above 90%, the market is in a phase of extreme optimism. It can be a time for partial exits, trailing stops, or hedging. Still, remember that in a strong trend the market can stay overbought by breadth for a long time, and that is normal.
Main advantage
By watching 50-200D breadth and its patterns, it can sometimes be better to avoid trading for half a year and then enter near the best lows. This can improve returns and help avoid painful drawdowns.
Intraday trader
Momentum Scalper
"5-day breadth is my main radar for finding short-term reversals."
Real-time scenarios:
For active trading, BreadthView is highly useful because it provides fast 5-day S5FD and NDFD breadth in real time.
When 5-day breadth falls toward the 5% zone, the market is often in short-term panic. This can be a useful long-entry moment with limited risk and a tight stop.
If 5-day breadth is already above 70%, it may be late to enter long: the market is overheated in the short term and a pullback is possible. The 90% zone is an area where intraday traders may take profits.
Important nuance
In intraday trading, breadth helps you avoid catching falling knives in the middle of a selloff and wait for selling climaxes at extremely low values.
Smart Money add-ons
RSI Breadth Expert
"In a bull market, breadth rarely falls to 10%. This is where I use breadth RSI."
Combined analysis:
BreadthView provides a unique tool: RSI for each breadth indicator. It helps solve the problem of finding entries in a strong rising market.
RSI < 30% signal
When the market is in a strong trend, breadth may not fall to 10%. An RSI signal below 30% on breadth suggests that enough pressure has been released to add to a position.
Bull market
Instead of waiting for a perfect bottom that may not appear for months, you enter on local RSI oversold conditions inside an uptrend.
This lets you act ahead of the crowd: while others fear the correction, RSI shows that breadth is already oversold and the market may be ready to rebound from current levels.
Systematic trader
Quant-Driven Strategy
"I remove emotion. I trade only when breadth confirms the probability setup."
Regime filtering:
Your strategy is built on understanding the global trend and probabilities.
Waiting mode
We stay cautious while long breadth is below 50% and continues to decline. At that point, downside risk is elevated.
Rare opportunity
We watch breadth approach historical lows or the 10% zone, where a recurring reaction often appears. This is an area where reversal probability is high and the stop can be tight. Breadth RSI is used as an additional signal.
Working with oversold conditions
Important: the market can remain breadth-oversold for a long time. We do not exit immediately; instead, we use it to maximize profit while trailing stops.
Practice
Chart analysis examples
Use the screenshots to see what signals breadth and RSI produced in the past, then look for similar patterns in BreadthView.
Current situation
radarLong entry point
Key indicators
bar_chartS5TW breadth
10%
RSI (S5TW)
<30%
RSI (SPY)
~30%
Confirming signals
hubAt the same time, RSI (S5FI, S5OH) is also in the red zone below 30%, which strengthens the signal.
Strategist's Note
Wait for the signal. Breadth RSI helps find add-on points inside an uptrend.
Ready to see the market differently?
BreadthView is in active beta. We are opening access to everyone who wants to study the market through breadth without restrictions.
Join the BreadthView beta tester community. Get early access to market breadth algorithms used by professionals.
Instant access after sign-in
Frequently asked questions
A short overview of why breadth analysis matters, how it helps with SPY and QQQ, and what beta access includes.
Important
BreadthView is intended solely for analytical and informational purposes. The platform is not investment advice and does not guarantee profit or any specific results.
All investment decisions are made by the user independently, based on their own strategy, goals, and acceptable risk level.